GPU Flight Recorder
GPU Flight Recorder is an open-source Windows tool that records what your PC was doing when the display froze. I built it when my own screen kept locking up for 10 to 25 seconds during Fusion and Blender sessions, and nothing available could tell me why.
The short version
A local desktop app that continuously records GPU telemetry, Windows events, power transitions, crash-dump filenames and display state, then turns a freeze into an inspectable report you can hand to support.
Independent collector threads, Win32 calls through ctypes, PowerShell and nvidia-smi probes, durable JSONL logging with crash recovery, a Tkinter control panel, freeze classification and support bundles, with CI on GitHub.
Systems engineering around failure: the recorder keeps working while the thing it watches is broken, and it never claims more than the evidence shows.
Counted from the repository on 4 October 2026.
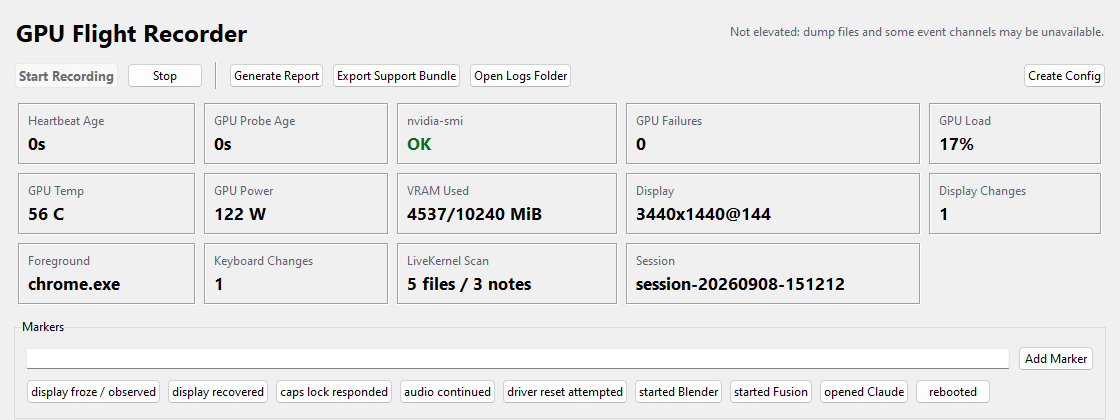
- AHeartbeat age. How old the proof-of-life signal is.
- BProbe age. A stale GPU reading looks stale, never current.
- CFailures counted separately. Probe failures are not mixed into load or temperature.
- DOne-click markers. “Display froze”, “audio continued”, “display recovered”: context the collectors cannot know.
Actual Windows recording, 8 September 2026, during normal operation.
One probe waits.
The heartbeat continues.
The heartbeat and the NVIDIA probe run on separate worker threads, and Windows events, display information, keyboard state and selected processes have their own collectors. A slow GPU query produces a timeout; it does not silence everything else.
6 heartbeat records written while the probe waited.
Write while the
evidence still exists.
Each observation is appended to a timestamped JSONL stream, and the default writer flushes and syncs every record to disk. That costs extra disk work, and leaves far less sitting in buffers when a session ends badly.
On the next launch, sessions still marked as running are recovered and reported. A line-by-line reader keeps valid records around a malformed one and preserves the damaged fragment as a parse-error record. A fixture with two complete records and a truncated third confirmed exactly that.
Recording and recovery
- 01AppendOne JSON line per observation
- 02Flush and syncEach record reaches the disk
- 03RecoverSessions still marked running are reported next launch
- 04Tolerate damageValid lines kept; the broken fragment preserved as evidence
A finding, with its
evidence attached.
The report combines markers, heartbeat activity and probe failures, separates startup blips from significant failures, and labels its conclusion as likely. Every conclusion links back to the evidence that produced it.
## Freeze Classification
- Analysis window uses display-freeze marker:
  2026-10-04T12:01:27-04:00 to 2026-10-04T12:06:42-04:00.
- Heartbeat evidence present: logger/Windows proof-of-life
  records continued in the analysis window.
- Display-path stall likely: heartbeat continued,
input/audio evidence exists, and GPU probing failed or stalled.Something another
person can inspect.
- Independent heartbeat, GPU and system collectors
- Visible signal ages and collector health
- Durable JSONL streams with recovery
- Observation markers
- Qualified freeze classification
- Bounded support-bundle export
It gave me the evidence I was missing: heartbeat proof-of-life, GPU probe hangs, Windows event timing and crash-dump filenames.
Need better evidence when a system fails? Start a conversation
All projects ↗Available for select projects and opportunities
Have a website that needs to win work?
Let’s work together. Have a project in mind or a role you’re hiring for? I’d like to hear about it.
Nothing opened? Use Copy address and paste it into your email app.